I love statistics.
Not the math behind them, per se, just reviewing them. Box scores, like the one below, are the best and most comprehensive way to quickly absorb a match’s happenings.
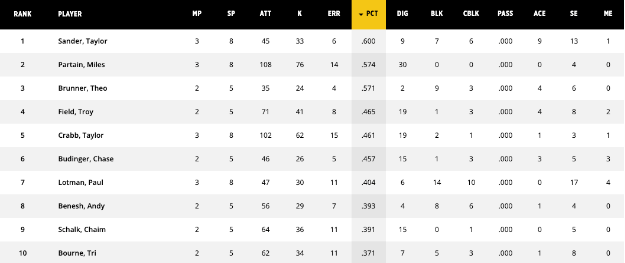
Looking at overall stats for a tournament may well explain why one team or player finished so well. Take a look below. Those are the Phoenix Championship stats. Not surprised that the top three hitting percentages came from 1st, 2nd, and 3rd-place finishing guys.
But everyone knows how great stats are. You may not know the formula for hitting percentage. Or what CBLK stands for. Time to break down the stats you continuously see in box scores and my articles.
Understanding stats is the best way, apart from actually watching, to digest info before, during, and after a match. I’m assuming base-level volleyball knowledge here. Don’t want to get too into the weeds about what an attack is. For that, head to our Volley Lingo cheat sheet.
MP = Matches played. SP = Sets played. These are both straightforward but important in quantifying the strength of a stat. I’ll explain in a bit.
ATT = Hitting attempts. Amount of times a player attacked a ball. Free balls over the net do not count. Attempts include kills, but also all the times you attack and don’t get a kill. This stat, along with most of the others, is an amalgam of all matches played within the parameters. You define the parameters with the dropdown boxes seen in the image below.
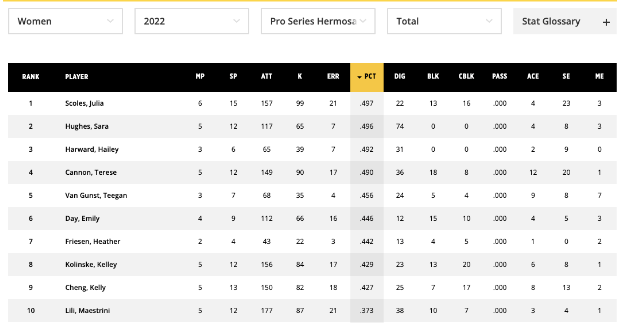
This page shows the Women’s stats for the 2022 Pro Series in Hermosa Beach, sorted top to bottom by hitting percentage. As a user, you can select different genders, years, and tournaments and can sort the data based on what you want to learn.
K = Kills. Any time the ball is terminated for a point from an attack. Free ball kills do not count, as their intention was not to score a point. Instead, a miscellaneous error is credited to the closest defender to account for a scored point. More on miscellaneous errors later.
ERR = Hitting Errors. Any time a point is awarded to the other team based on a failed hitting attempt. This includes hitting out or into, getting blocked, or a ref calling the plyer in the net.
PCT = Hitting Percentage. This is the stat that prompted this whole article because of how indicative it is of a good player. The hitting percentage formula is:
Kills – Errors
Attempts
So if I get 15 kills and 3 errors on 27 attempts, my hitting percentage would be 15-3 = 12/27 = .444%. This essentially means that 44% of the time I attack a ball, I will earn my team a point. Hitting percentage is basically a “net” points scored percentage as it takes points scored minus points given to the other team.
Hitting percentage is so vital because it shows how consistently a player is producing for their team. In beach, both players must be terminal, always looking to score a point. Even if you’re not being served, whenever you touch a ball, you’re thinking, “how can I score a point?” No one serves Phil, but his hitting percentage is always high. When he gets a chance to option, a touch off the block, or the rare serve receive, he’s terminal.
Hitting percentage is also a valuable stat because it doesn’t matter how many matches or sets you’ve played. It’s an unflawed formula that applies to individual matches. It can then be combined across matches to provide a comprehensive stat.
Yes, it’s a little more impressive if you play 10 matches and maintain a .550% hitting percentage. But a player with 10 matches has just as much room to do well as they do to perform poorly. It’s all relative, but hitting percentage is about as pure as you get.
Dig = Digs. Digs are any first touch besides serve receive. Passing a free ball, covering a block, or passing a hard-driven hit. To learn the number of digs per set, which I believe is a more telling stat, divide the number of Digs/Sets Played.
BLK = Blocks. These are only terminal blocks that result in a point for your team.
CBLK = Controlled blocks. These are the block touches that lessen the effectiveness of an attack, continuing the play. These can be balls tipped to yourself for an attempt/dig. Controlled blocks are also balls diverted to your partner off a touch at the net. Any time the blocker touches the ball and play continues.
PASS = Serve Receive Percentage. A player is awarded a 1 if it’s a good pass or a 0 if it’s an ace. This is a working stat that is only available sometimes and will improve with time. For now, just skip this one.
ACE = Aces. An ace is defined as a serve that results in a point. Some people think it should be a serve that is not touched at all or only touched by one opponent. But the AVP considers any point that is clearly scored because of the serve an ace.
SE = Service Errors. Any serve that results in a point for the other team – out, in the net, foot fault.
ME = Miscellaneous Errors. These are setting errors, like a lift or double. Also, net errors that are not committed during a hitting attempt (that’s a hitting error). So any net touch from brushing up against the net to being in the net on your block.
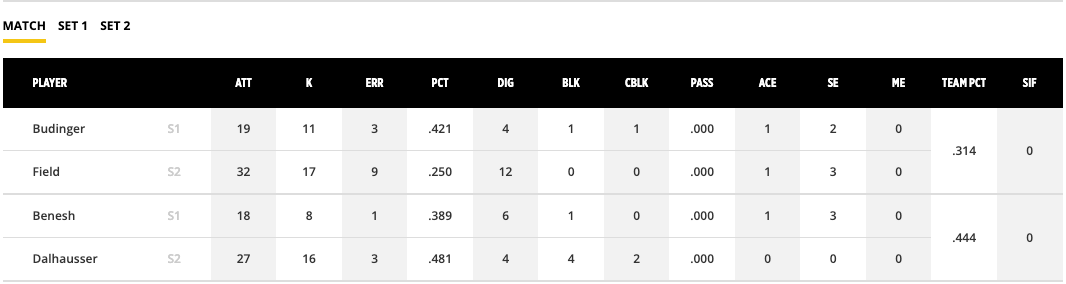
In box scoring, there’s also a TEAMPCT = Team Hitting Percentage. This is the combination of both partners’ hitting percentages. So:
Total Team Kills – Total Team Errors
Total Team Attempts
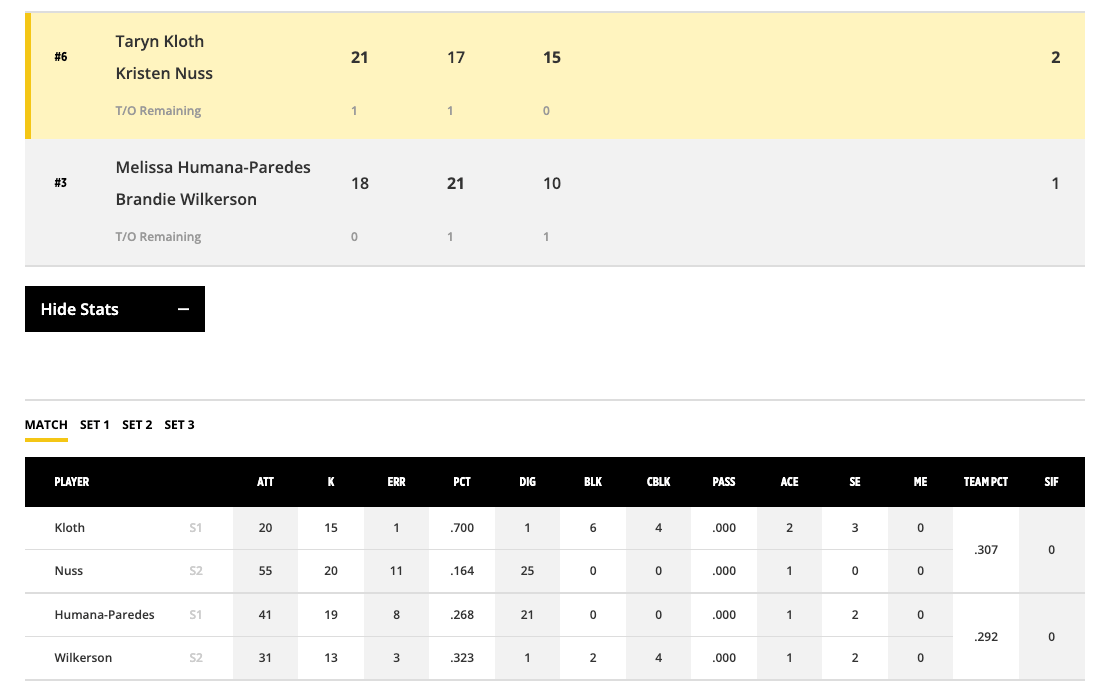
TEAMPCT is another excellent indication of the better team during that match. Look at the hitting percentage in the Chicago Women’s Final below. It makes sense that TKN’s Team Hitting Percentage was barely better than MHP and Brandie’s. Even further, if you go to this box score online and check out this match, the TEAMPCT for each set indicates the winner of that set.
SIF = Serves in the Freeze, which we don’t do anymore. Disregard!
So let’s apply a little realism to the numbers, sticking with the Chicago theme.
Kristen Nuss had 138 digs at Oak Street Beach in 2022. She played 16 sets, which means she notched an astoundingly impressive 8.6 digs per set (138/16). Note that she played 6 matches, which means 4 of her matches went to 3 sets ((4*3=12) + (2*2=4) = 16 sets).
The tournament stats only indicate sets played, not how points those went to. So Kristen got 8.6 digs per set, including 4 sets to 15 points. Aka – she’s even better than the initial numbers.
And that’s what stats tell you. It’s my favorite part of a tournament recap, seeing how the stats support the story. The stats rarely disagree with the finish, but it’s also kinda fun when they do. Because as someone who normally watched the match in question, I can ascertain what the X-Factor was. Maybe Sally had a great hitting percentage, but were her three errors all at the end? Did Helga get in her head at the last second and win the match even with worse stats? The stats tell a story, but the only story worth telling is the real one.
And that, my friends, is why we watch sports and don’t just review the box scores.